Performance Analysis Tools
Software rarely achieves the peak performance of a processor. Performance optimization and adjustments to specific architectures are a common task in high-performance computing. Often we ask ourselves why the performance lower than expected or why the application does not scale when using many cores.
Because performance problems are hard to find, analysis tools often used. Such tools can help programmers to understand the performance relevant issues within a program. In current systems, the memory is often the bottleneck and it requires knowledge and effort to use the memory system in a way to achieve the best performance.
We work on such tools that can help to find performance problems and optimization opportunities in complex code. Such tools can help to explain what exactly is going on inside the processor and how exactly it executes the code. To gather information about how software is executed and to know what the hardware is doing we use performance counters and instruction sampling.
Performance counters are a hardware feature that allows us to count the occurrences of certain events. For example, the number of cache misses the number of divide operations and many more. In total there are hundreds of events available to count on modern processors. Instruction sampling is another hardware feature that allows us to sample certain types of instructions and events. It allows precise attribution of events to functions, source code lines data.
The challenge in developing useful tools is to first to decide what to measure out of the vast amount of options and second to interpret the results. It is usually not possible to draw conclusions about performance problems from the raw data.
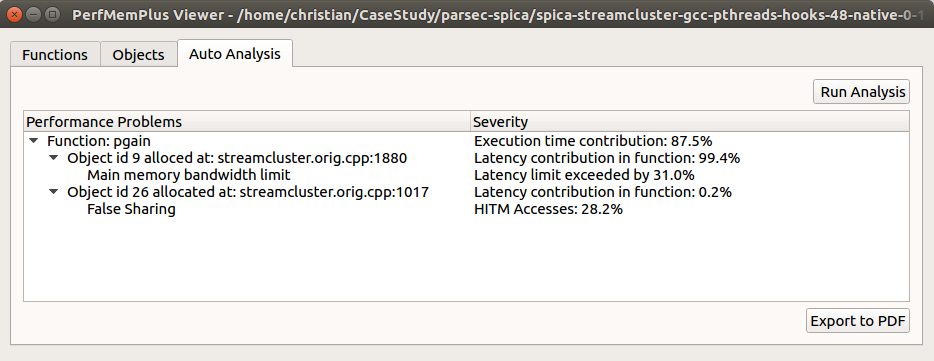
We work on tools that help users to configure useful events and help to understand the recorded data. For example, the data can be used to automatically identify problems such as false sharing or main memory bandwidth contention.
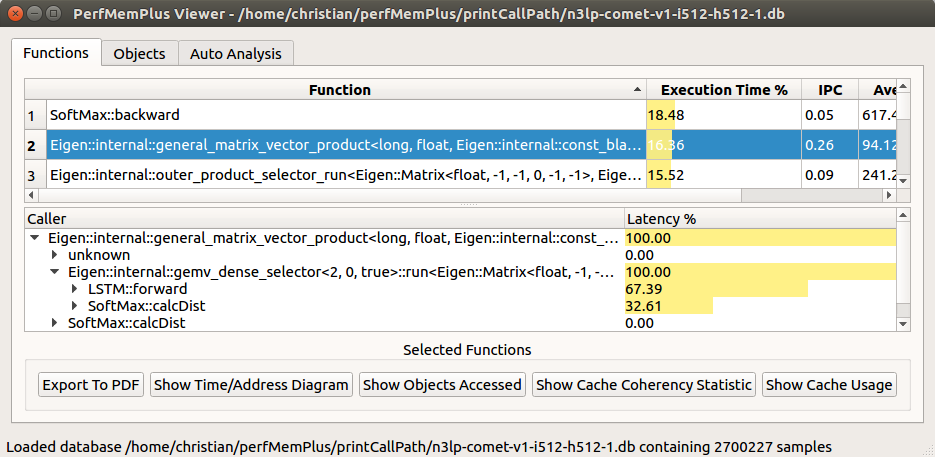
We have implemented a performance analysis tool which is based on Linux Perf. Perf is a very powerful, general-purpose performance analysis tool, but the event selection and data interpretation is the challenge. We have developed a few tools around Perf that help us to capture the data required for analyzing memory problems and analyze the data using a GUI.

Finding performance problems by manual exploration of the data is possible. We have also developed an automated detection method for certain performance problems. There are still many aspects in the available to performance data that are not or only partly used by existing tools.